


How to find the right neighbourhood in your new city?
- Tennyson Wu
- Apr 1, 2021
- 6 min read
Last year I completed a data science course on Coursera. The cumulation of that course was a capstone project that included a blog post about the results of my project. I posted that post on LinkedIn. Now I decided that for documentation purposes, I would have the contents of that blog post on my website too.
It is much longer than blog posts I tend to write, but here it is.
Recently I have been working through a series of data science courses presented by IBM . These nine courses make up the Data Science Professional Certificate on Coursera.
The cumulation of these courses is a capstone project to apply what I have learned over these nine courses. Here is my capstone project.
Background
In an increasingly globalised world, more people are finding opportunities to work abroad. Yet, it is not always so easy to find the right neighbourhood in the new city. The aim of this project is to compare the neighbourhoods in two cities to determine how similar the cities are to live in, and to assist in finding a suitable neighbourhood in the destination city.
Personally, I spent a year in Amsterdam while completing my master’s program. It was a great experience, so much so that I am currently searching for work in the Netherlands. Some incredibly interesting opportunities are in Rotterdam.
This project will attempt to apply k-means clustering to the neighbourhoods in Amsterdam and Rotterdam to better understand these two cities and find places in Rotterdam I would enjoy living in.
Data
Finding Data
Two sets of data are required for this project.
Lists of neighbourhoods for Amsterdam and Rotterdam, and their geographic coordinates are needed to identify the neighbourhoods and place them on a map. Conveniently these lists were on Wikipedia, and most of the coordinates were easily found through an online platform, Coordinates Finder.
The venues in each neighbourhood, what type of venues they are, and their geographic coordinates are also needed to compare the neighbourhoods.
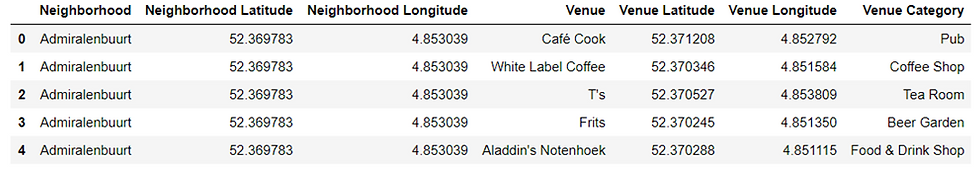
Foursquare is an online platform where individual users identify information about venues around the world. The types of venue data described above were extracted from Foursquare through requests sent to the Foursquare API via Python code.
Here is a sample of venue data from Foursquare.
Checking Data
The coordinates of the neighbourhoods were checked by visual observation of the data. A manual Google search helped correct the coordinates that were clearly incorrect.
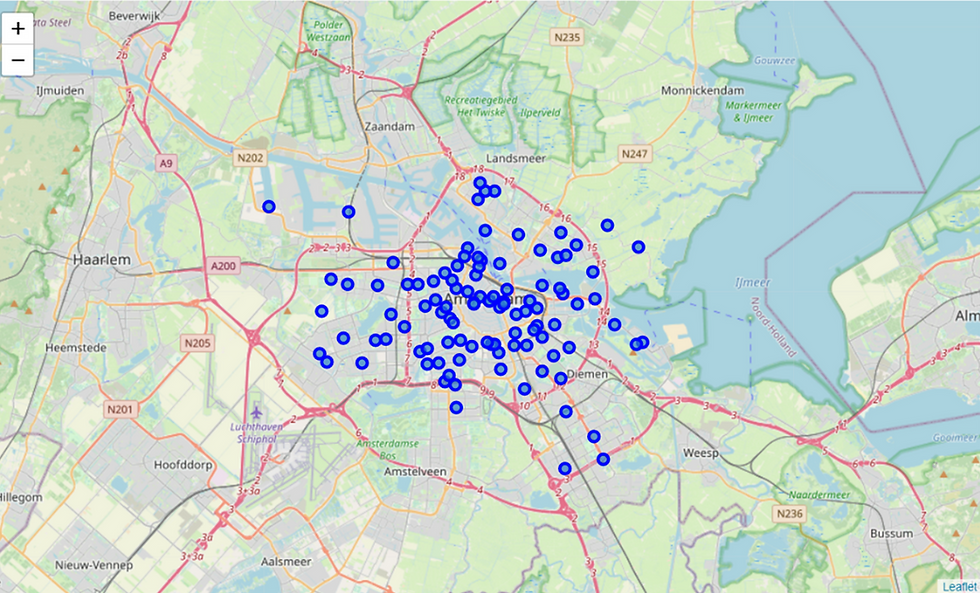
Here is a map of Amsterdam and its neighbourhoods.
Here is a map of Rotterdam and its neighbourhoods.
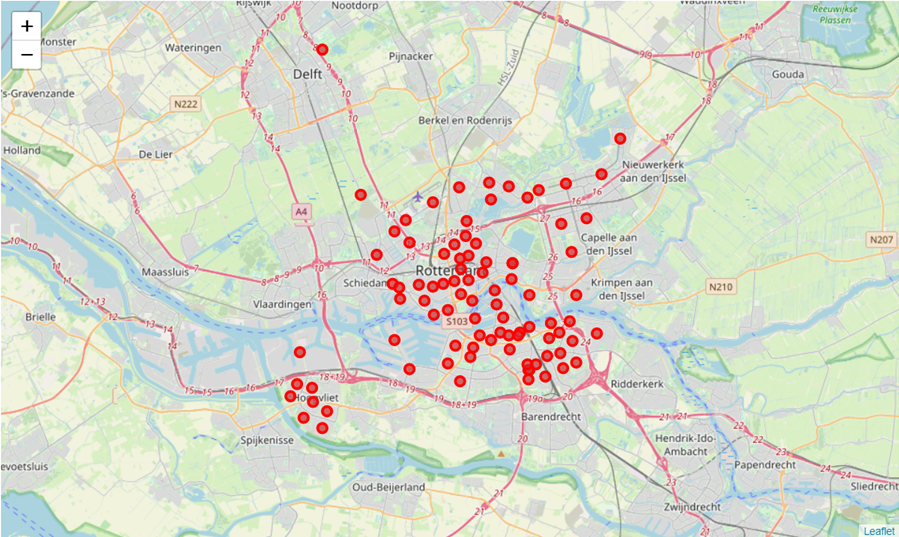
Strangely there is a Rotterdam neighbourhood in Delft. Obviously, that is not right. A quick investigation revealed that the list of Rotterdam neighbourhoods on English Wikipedia included a neighbourhood called Nooddorp. I could not find this place on Google Maps, or anywhere else.
Then I found the Dutch Wikipedia article on Nooddorp; it was a term for neighbourhoods around Rotterdam where emergency shelters were set up during World War 2.
So, Nooddorp was dropped from further study.
Transforming data
To prepare the venue data for k-means clustering, the individual entries for each venue were grouped by neighbourhood and summarised by venue type. The total number of venues were then calculated for each neighbourhood.
During the data science program neighbourhoods in prior k-means clustering exercises were clustered by the top 10 most common venue types.
Here, totals for each neighbourhood were checked to determine how many neighbourhoods have little venue data; it makes no sense to consider the top 10 most common venue types for a neighbourhood that does not have 10 recorded venues.
Based on this check, it seemed that using the top 10 most common venues would mean dropping too many neighbourhoods. After all, how can I compare the two cities if large chunks of both are missing from the analysis. Using the top 5 most common venue types meant that more neighbourhoods could be used, and even more so for using just the top 3.
But then the issue becomes a trade-off between having enough data for the results to represent the cities properly and having enough complexity in the features for k-means clustering to create good groupings. The top 5 forces us to use less data than the top 3, but also allows more features for the k-means clustering to create groupings with.
Eventually I decided, why not both?
K-means clustering
Very simply put, k-means clustering is a process of grouping a set of data into k clusters where each observation is part of the cluster with the closest centre or mean.
The next decision was how many clusters would be optimal. There are several methods to determine the optimal value for k, the number of clusters. The method we were taught in the online classes was the Elbow Method.
Choosing the optimal k was done for the dataset with the top 5 most common venue types and the top 3, but for brevity I am focusing on the top 5 here. The results for the data using the top 3 most common venue types were largely similar to the top 5.
For the Elbow Method, the sum of square distances of each point to its assigned cluster centre were calculated, for each value of k, and then plotted on a graph.
Here is a graph showing the results calculated for the Elbow Method.
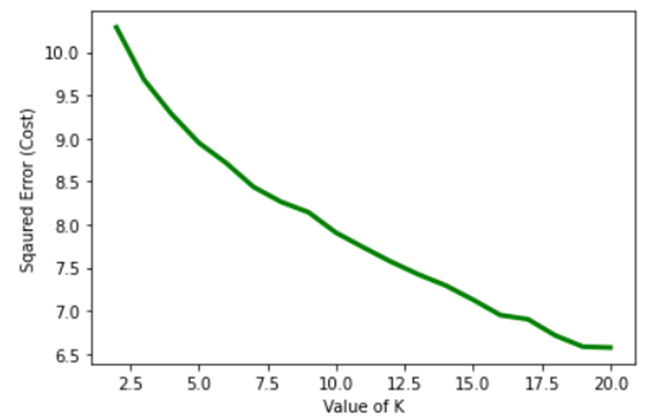
According to the Elbow Method, the optimal value for k is the “elbow” point, just before the line starts to plateau or decrease linearly. This graph does not show a very clear “elbow” point; maybe k is 5.
For reference, here is what a good “elbow” point looks like:

(Image sourced from Geeks for Geeks)
So, the Elbow Method was not too helpful, then what about other methods for finding the optimal number of clusters?
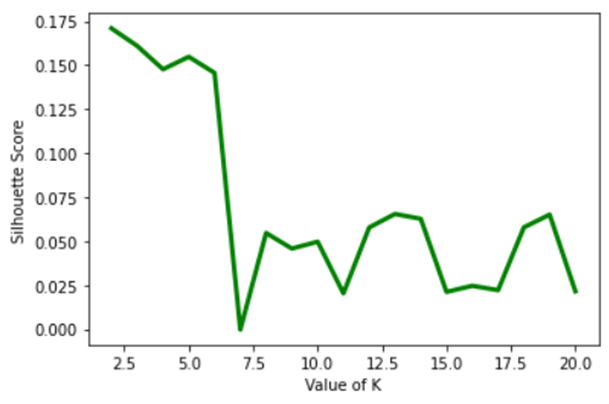
I looked at Silhouette Scores and Davies Bouldin Scores as well. The Silhouette Score measures how similar a neighbourhood is to its own cluster compared to other clusters; higher scores indicate better clustering. The Davies Bouldin Index measures how distinct the clusters are from each other; lower scores indicate more successful clustering.
Here is a graph showing the results calculated for different Silhouette Scores.
Here is a graph showing the results calculated for different Davies Bouldin Scores.
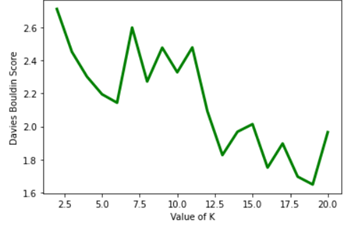
The Silhouette Scores would suggest an optimal k of 2, while the Davies Bouldin Scores would possibly suggest 19, though there is also a local minimum around 5 or 6.
Overall, all three methods did not lead to a strong consensus, so that was not too helpful. After much thought I decided that k, the number of clusters, would be 5 based on the results of the Elbow Method.
Results
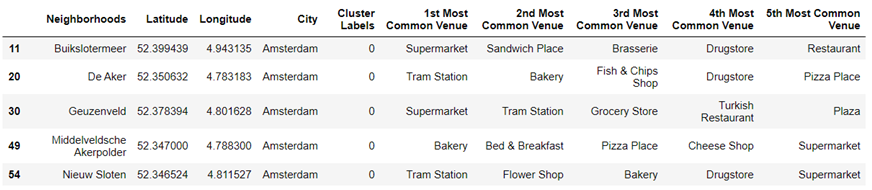
There are too many neighbourhoods to show all the results in this post. For illustrative purposes, here is a sample of the results for cluster 0.
Looking at the various clusters a pattern could be seen in most.
Cluster 0 (red) – the most common venue type is a supermarket for most neighbourhoods.
Cluster 1 (purple) – bus stops are the common factor here.
Cluster 2 (blue) – all three neighbourhoods here have soccer fields.
Cluster 3 (green) – bars, cafes, coffee shops and restaurants featured very prominently.
Cluster 4 (orange) – a mix of outdoor venues (parks and sports centres), and different shops.
Here is a map of Amsterdam and its clustered neighbourhoods.

Here is a map of Rotterdam and its clustered neighbourhoods. The colours correspond to the same clusters as the neighbourhoods in Amsterdam.
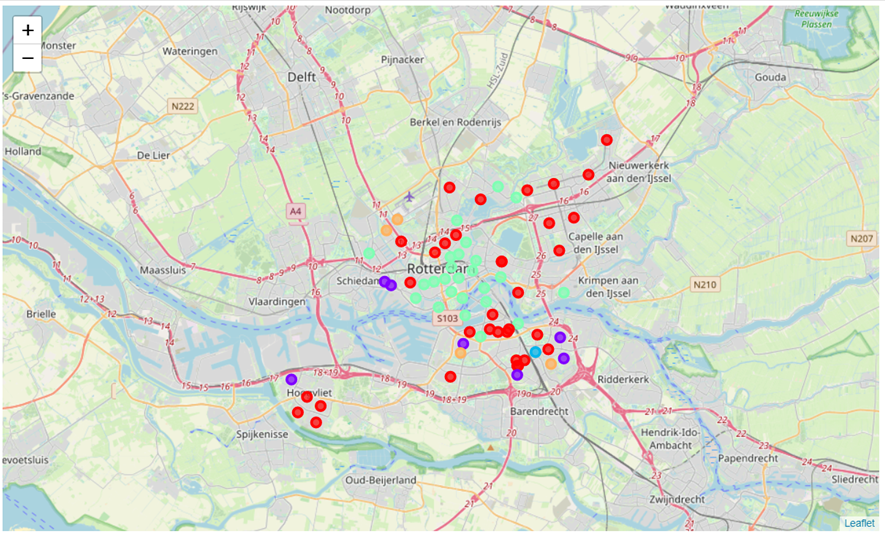
Very clearly, Amsterdam has many green neighbourhoods, filled with bars, cafes, and coffee shops. This is as expected of the world-famous tourist city. Like Amsterdam, Rotterdam also has many green neighbourhoods in its centre. However, it appears Rotterdam also has many red neighbourhoods where supermarkets are the most common venue type.
The results of clustering the top 3 most common venue types were fairly similar to the top 5, except there was a cluster of parks instead of soccer fields and a cluster of tram stations in instead of a mixed cluster.
Discussion
For my year in Amsterdam I lived on the outskirts of the city, where there was plenty of outdoor space and nature, and easy access to many shops. Also, very conveniently there was a train station nearby.
By taking the types of neighbourhoods around where I lived in Amsterdam and comparing them to different parts of Rotterdam, I could find an area in Rotterdam with a similar composition of neighbourhoods.
According to the results for the top 5 most common venue type, the best place for me to live in Rotterdam would be Kreekhuizen. A closer look at Kreekhuizen on a map reveals a beautiful large park a block away from the centre of the neighbourhood. There are also many sports fields nearby and even a large train station.
According to the results for the top 3 most common venue type, the best place for me to live in Rotterdam would be Oud-IJsselmonde. Surprisingly, this neighbourhood is quite close to Kreekhuizen, 2 kilometres away by bicycle. Oud-IJsselmonde is on the banks of the river Nieuwe Maas; there is a nature preserve island too.
Conclusion
Overall, the neighbourhoods in Rotterdam appear to share many similarities with Amsterdam.
The largest exception is the cluster associated with bars, cafes, and coffee shops. Amsterdam appears to have many more neighbourhoods like this compared to Rotterdam. Based on my experiences with Amsterdam this makes perfect sense, since Amsterdam is a large tourist destination.
Personally, I was able to find a neighbourhood in Rotterdam that seems remarkably similar to the one I lived in during my time in Amsterdam.
Other people moving to new cities can follow the process used in this project to gain a better understanding of the city they will be moving to, and find a new neighbourhood that they would enjoy living in.
Overall, I would be happy to live in either neighbourhood recommended by this process. Of course, this approach has several limitations which I discuss more in my report. All said, I rather enjoyed working on this project and the 9 courses leading up to this capstone.
Комментарии